Mapping people’s jobs to be done to find AI’s bigger opportunities
Table of contents

Mapping people’s jobs to be done to find AI’s bigger opportunities
Most organizations are adopting AI the same way. They look at the workflows they already have and ask which steps a model could take over. The focus tends toward automating low-level tasks: draft the release notes, summarize the support tickets or produce more content for the blog. Each is reasonable, and plenty will pay off.
But it’s a narrow way to meet a technology as big as AI.
As Marshall McLuhan observed, we look at the present through a rear-view mirror and “march backwards into the future.” Early TV looked like stage shows with a camera pointed at them. Early websites looked like printed brochures. Automating today’s workflows with AI is the same move. We take a new capability and pour it into the shape of the old one.
AI is more than an automation tool. It’s a paradigm shift, and we may not be equipped to grasp where it leads. That’s an uncomfortable thought, and it’s also hard to act on. Leaders asked to redesign how a company works can’t put “prepare for a paradigm we can’t imagine” on a roadmap. So they default to what’s concrete, which is the workflow in front of them.
To be clear: optimizing today’s workflows is a fine near-term step. The risk is stopping there. If all you do is make the current machine run faster, you may not notice when the machine itself stops being the right one.
Mapping the ecosystem
Breaking away from legacy thinking takes a view broader than individual workflows. The bigger opportunities sit in the domain the organization operates in: the people it serves, the partners and competitors around it, and the other services those people rely on to get things done. Some of the most significant shifts will come from value moving across players.
Mapping today’s domain won’t reveal the paradigm that’s coming. Nothing will. What it does give you is stable footing. A map of what people want to achieve and the players around them gives you something durable to reason from as everything else shifts. It also helps you spot change early, because you’ll see where it lands.
The aim is to see how value flows. The job of an organization is to create value and then capture some of that value. A map of the broader ecosystem shows where value gets created for people in a domain and where it ends up. Some of it is captured by the players in the system, and some of it leaks away.
An ecosystem map shows the relationships between entities that make up an experience, including offerings outside your walls and even those of competitors. As products and services become more interconnected, the idea of a standalone offering fades. What matters is how well your services fit with one another and, more importantly, how well they fit into people’s lives.
Consider this example created by Paige Roche and Trevor Connolly, leading service designers. It shows the objectives a customer has when purchasing a car, in blue on the top, and how that aligns with the primary functions of a car dealership, in black on the bottom.
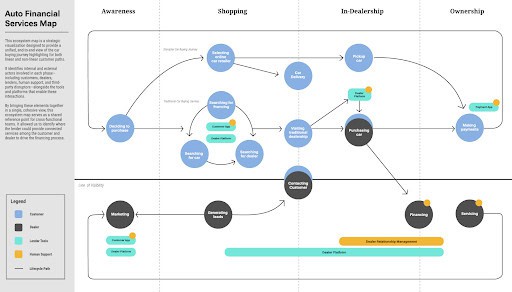
This simple visualization orients a team to the bigger picture of buying a car. They may zero in on, say, the circular process in the “Shopping” phase that oscillates between searching for financing, searching for a car, and searching for a dealer. Today the customer stitches those three searches together alone, going back and forth until they line up. An AI agent could work all three at once and bring back a car, a loan and a dealer that fit together. The loop disappears.
Framing the map around jobs to be done
The Jobs to Be Done (JTBD) framework sharpens the picture. Most teams describe their work in terms of activities and solutions, such as “optimizing SEO with more content on the blog.” That framing locks in the current approach. Ask what job that activity serves, say attracting new customers, and the conversation changes.
From a JTBD perspective, we focus on the objective the individual seeks to achieve. That detaches our thinking from current solutions. It also gives the ecosystem model a longer shelf life, because jobs framed around intent stay stable while technology churns.
Cornelius Rachieru, managing partner at the strategic design consultancy Ampli2de, builds ecosystem maps from the bottom up: first the actors in a domain, then the jobs each is trying to get done, clustered into groups, and finally data lenses relevant to the business.
The figure below shows Rachieru’s model for retirement. Retirees sit at the center. Around them are clusters of jobs like meeting housing needs, getting daily assistance, accessing medical care, getting around and enjoying social activities. Rachieru’s lenses are about service gaps and cost. For AI, a few others are worth adding.
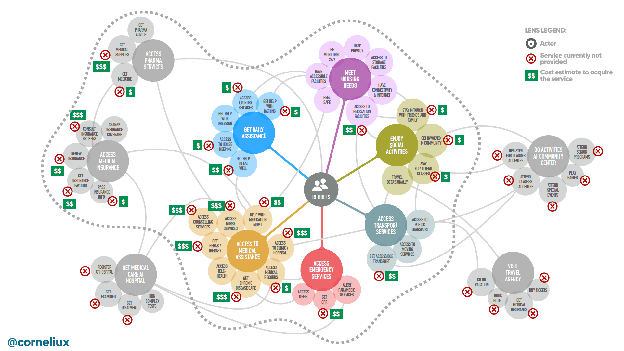
Notice what the map doesn’t show. There are no departments, tools or workflows, and no single company sits at the center. It shows what people are trying to accomplish and where the system currently fails them. That’s the level where AI’s bigger opportunities live.
Reading the map through lenses
Adding “lenses” is a key diagnostic aspect of ecosystem mapping. The diagram itself provides no answers outright. Instead, layer specific facets of information on top to provide different insights.
Once you have an ecosystem map, the tempting question is “Which parts can AI take over?” That’s the automation question again, asked at a larger scale. A better question is: “How might AI help us create more value for customers?” Asked against a map of jobs, that question gets specific quickly. The lenses below are ways of answering it.
- Value creation. For each cluster of jobs, ask how much value it creates for the people at the center today, and how much more it could create. Some clusters matter enormously to people but are poorly served. That’s where new value is waiting. Then ask who captures that value now. Where a player captures value mainly by sitting in the middle, that position is exposed, and it may be yours.
- Coordination friction. Look for places where getting a job done depends on handoffs between people, teams or companies. This is where AI changes the economics most.
- Cost to serve. Some gaps exist only because filling them with people costs too much. The retirement map already shows this with its cost overlay. Ask which of those gaps would start to make sense if the cost of delivery fell sharply.
- Cluster boundaries. Some clusters are separate only because of how an industry happens to be organized. The person getting the jobs done doesn’t experience them that way. Ask which boundaries exist for the provider’s convenience rather than the customer’s. The car shopping loop mentioned earlier is a case in point.
Each answer becomes a provocation. What if this gap cost a tenth as much to fill? What if these three clusters were one service?
The answers to such questions force strategic decisions. You can’t pursue every job at once, so a team has to decide where to focus. That decision sits at the overlap of two questions: what matters most to the people you serve, and what matters most to the business right now. Having the whole ecosystem in front of you lets a team have that conversation together instead of defaulting to whatever is already on the roadmap.
From there, sort the provocations by how soon they could matter and how sure you are about them. In practice, you might end with three kinds of moves:
- Act now: near-term changes, often workflow automation, chosen because they point in a direction the team has agreed on.
- Experiment: one or two small tests aimed at a gap or a merged cluster, cheap enough to learn from either way.
- Watch: signals that a bigger shift is arriving, such as a new entrant appearing in an adjacent cluster or costs dropping sharply somewhere on the map.
The watch list is the easiest to skip and probably the most important. It’s how you recognize the future when it shows up instead of seeing it only in hindsight.
A word of honesty: this is a proposal. Ecosystem mapping and JTBD are each well established, but using them together to rethink a business for AI is something I’m putting forward, not a proven playbook. If you try it, I’d like to hear what happens.
It’s the facilitation, not the map
The ecosystem map is a model to rally around. Its value comes from the conversation it makes possible. Put a jobs ecosystem map in front of a cross-functional team with no structure and you’ll mostly get a tour of everyone’s existing assumptions.
The insights come from facilitation. That means asking where the friction really sits, which gaps people have quietly accepted as permanent, and which clusters only look separate because of how the industry happens to be organized today. Good facilitation makes it safe to question the parts of the business that feel fixed. It also keeps the group at the level of jobs instead of sliding back into the solutions they already know.
The point is to make the invisible visible, so a team can hold a broader, more expansive view of what’s possible. Your first move may very well be workflow automation. The difference is that you’ll choose it on purpose, as a step in a direction, rather than because it was the most obvious thing in front of you. You’ll also have a reference point. When the larger shift starts to show up, you’ll be far more likely to recognize it, because you’ll know where on the map to look.
McLuhan wasn’t telling us to stop looking in the rear-view mirror. We can’t help it. His point was to be aware that we’re doing it, and to keep glancing at the road ahead.
Jim Kalbach is an author and speaker on customer experience, strategy, and design. He is the author of Mapping Experiences and The Jobs To Be Done Playbook. Connect with him on LinkedIn.